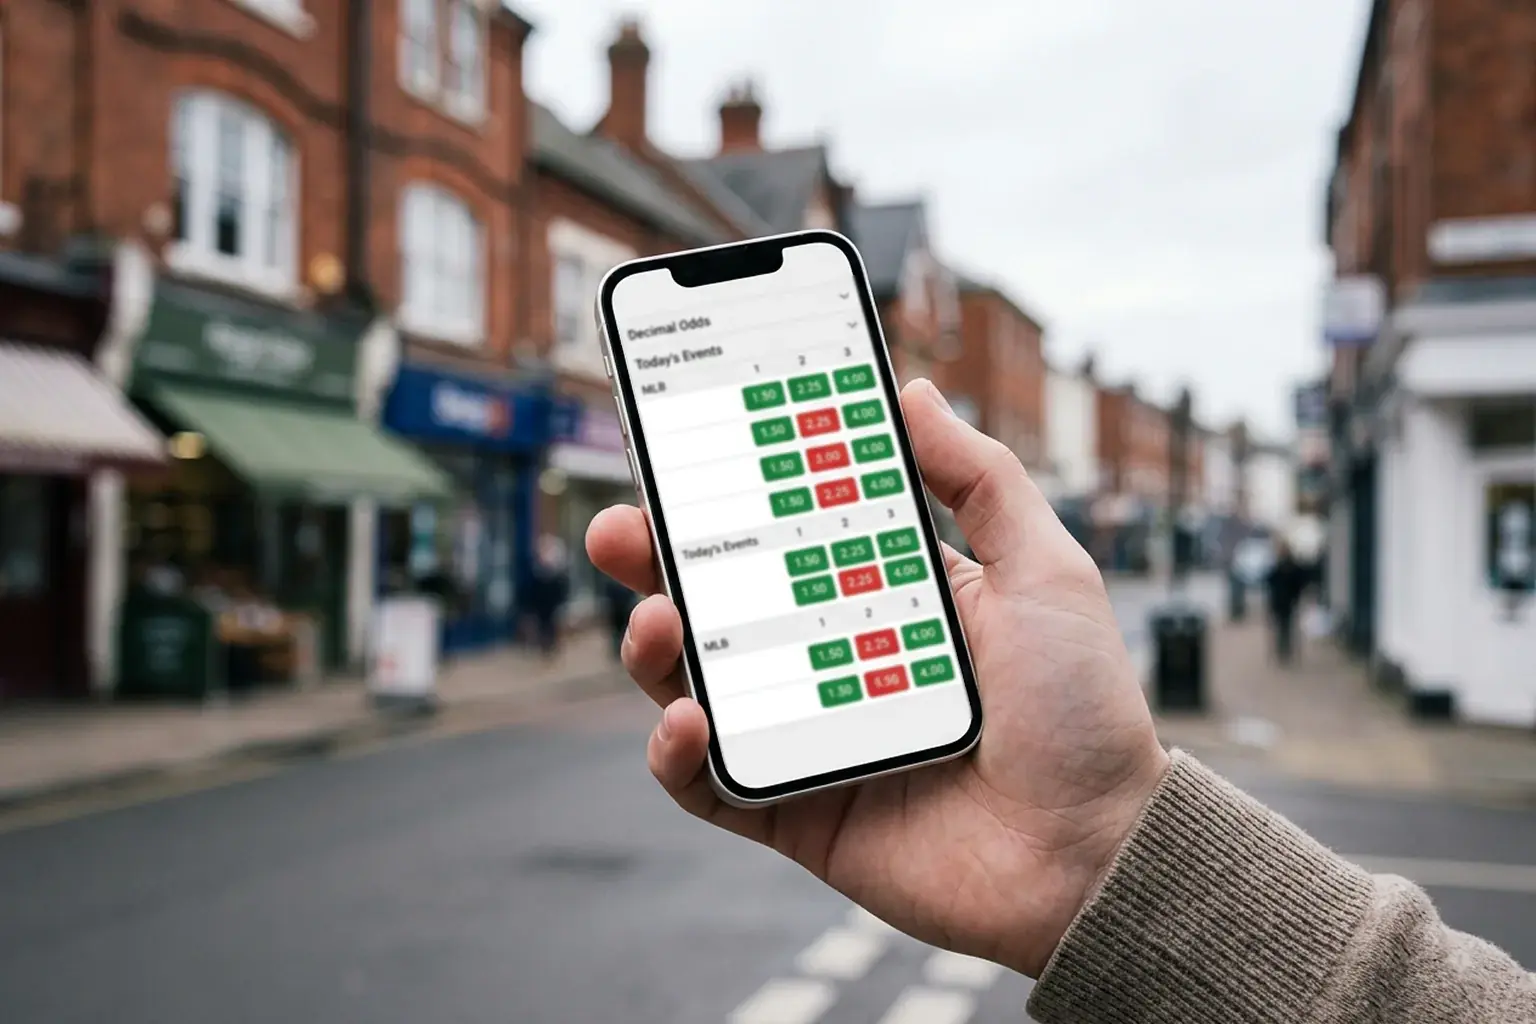
MLB Prop Betting
MLB Bet Props: The Complete UK Punter’s Guide to Player Proposition Wagers
By MLB Prop Betting Analyst

Table of Contents
- Five Principles That Underpin Every Profitable Prop Season
- Why MLB Bet Props Are the Sharpest Edge in Baseball Wagering
- What MLB Prop Bets Actually Are — And Why They Differ from Match Odds
- Every MLB Player Prop Market Explained
- How to Spot Value in MLB Prop Lines
- Ballpark Factors and Weather: The Hidden Variables
- Same-Game Parlays: Opportunity, Maths and Risk
- The Integrity Question: Clase/Ortiz and What Changed
- Betting MLB Props from the UK: Sportsbooks, Odds Formats and Rules
- Bankroll Rules for Prop Bettors
- The MLB Prop Calendar: When Each Edge Peaks
- Common Questions About MLB Bet Props
Five Principles That Underpin Every Profitable Prop Season
- Player props account for 70-75% of all same-game parlay bets, making individual-performance markets the dominant force in modern sports betting — not a side category.
- Value comes from comparing your data-driven probability estimate against the implied probability in the odds. An edge of at least three percentage points after vig justifies a bet; anything less is noise.
- Same-game parlays carry a 20-35% hold rate versus roughly 4.5% on singles. Limit SGPs to two or three genuinely correlated legs.
- UK punters face a distinct regulatory environment: financial vulnerability checks trigger at GBP 150 net spend over 30 days, and the statutory gambling levy is reshaping operator margins.
- Flat staking at 1-2% of bankroll per bet, adjusted weekly, protects your capital across a 162-game season where only 3-5% of bettors finish in profit long term.
Why MLB Bet Props Are the Sharpest Edge in Baseball Wagering
Nine years ago, I placed my first MLB player prop — a strikeout over on Max Scherzer facing the Reds. I had no model, no system, just a hunch that a power pitcher against a free-swinging lineup would fan a few batters. He cleared the line by two. That single bet taught me something that took most of a decade to fully appreciate: proposition wagers on individual players are where the sharpest edges in baseball hide, because the market is built on individual performance data that most punters never bother to interrogate.
The numbers behind that instinct have only grown louder. Player props now represent roughly 70-75% of all bets placed in the same-game parlay category, according to Huddle’s SVP of Trading, Tom Daniel. Six of the seven most popular SGP markets focus on individual performances. That is not a niche corner of the betting landscape — it is the landscape. The US sports betting market is projected to reach $27.42 billion by 2034, and the player prop segment is driving a disproportionate share of that growth.
Why props suit UK punters especially well: MLB runs from late March through October, offering 2,430 regular-season games. Most evening fixtures start between 23:00 and 02:00 BST, which means you can research during the day, place your props before bed, and wake up to results. The sheer volume of daily matchups creates pricing inefficiencies that simply do not exist in a 38-match Premier League season.
Karl Danzer, SVP of Odds Services at Sportradar, put it plainly: converting someone to sports betting is easier if they are following a player. That observation captures why props have exploded. You do not need to understand the American League wildcard format or care about the Kansas City Royals’ bullpen depth chart. You need to know whether one pitcher, facing one lineup, in one ballpark, on one night, will strike out enough batters to clear a line. That is a question you can answer with data — and that is precisely what this guide will teach you to do.

I have written this specifically for UK-based bettors, because every major resource in the top ten search results is built for an American audience. They quote American odds, ignore Gambling Commission regulations, and never mention the financial vulnerability checks that could freeze your account mid-season. This guide uses decimal odds, references UK-licensed operators, and addresses the regulatory framework you actually operate within. Whether you are placing your first ever prop or looking to sharpen a system that is already running, the framework here will give you a structural advantage.
What MLB Prop Bets Actually Are — And Why They Differ from Match Odds
The first time I tried explaining MLB props to a mate who only bets football accumulators, I said: “Forget who wins. Bet on what one player does.” His face changed. Suddenly the sport made sense to him, not as a team contest he did not follow, but as a series of individual duels he could analyse.
A proposition bet — prop for short — is a wager on a specific outcome within a game that does not depend on the final score. In MLB, the overwhelming majority of props centre on individual player statistics: how many strikeouts a pitcher records, whether a batter hits a home run, how many total bases a hitter accumulates, or whether a runner steals a base. These are over/under markets. The sportsbook sets a line — say, 5.5 strikeouts for a starting pitcher — and you decide whether the real number will land over or under that mark.
Proposition bet (prop) — a wager on a specific event or statistical outcome within a game, independent of the match result. In MLB, props typically focus on individual player performance metrics.
This is fundamentally different from match odds, where you are predicting a winner across a nine-inning contest shaped by 50+ players, managerial decisions, and bullpen sequencing. Match odds compress enormous complexity into a single probability. A player prop isolates one variable — one pitcher’s arm against one lineup — and that isolation is precisely what makes it researchable. You can quantify a pitcher’s swinging-strike rate to two decimal places. You cannot quantify “team momentum” at all.
| Market | Line | Over odds | Under odds | Implied probability (over) |
|---|---|---|---|---|
| Pitcher strikeouts | 5.5 | 1.87 | 1.95 | 53.5% |
| Batter total bases | 1.5 | 1.80 | 2.00 | 55.6% |
| Batter home run (yes) | — | 4.50 | 1.18 | 22.2% |
Hypothetical decimal odds for illustration. Implied probability = 1 / decimal odds, before removing the vig.
The US sports betting industry recorded $16.96 billion in revenue in 2025 — a record — and props are the fastest-growing slice of that figure. Eighty-eight percent of pre-match Bet Builders on the most recent Super Bowl contained a player prop, according to Kambi’s 2025 trends report. The appetite for individual-performance markets is not an American curiosity; it is a structural shift in how the entire betting industry operates, and MLB is one of the richest grounds for it because the sport generates more granular, publicly available performance data than any other.
For UK punters, the key mental shift is this: you are not betting on baseball. You are betting on a measurable, repeatable, data-rich individual performance. The team result is irrelevant. The division standings are irrelevant. What matters is the pitcher, the lineup opposite him, the park, the weather, and the umpire behind the plate. Everything else is noise.
Every MLB Player Prop Market Explained
I once watched a punter agonise for twenty minutes over a home run prop, completely unaware that the same sportsbook offered a total bases market on the same hitter at far better value. Knowing the full menu changes how you order. Here is every player prop market you will encounter on a UK-licensed book, grouped by whether you are betting on the pitcher or the batter.
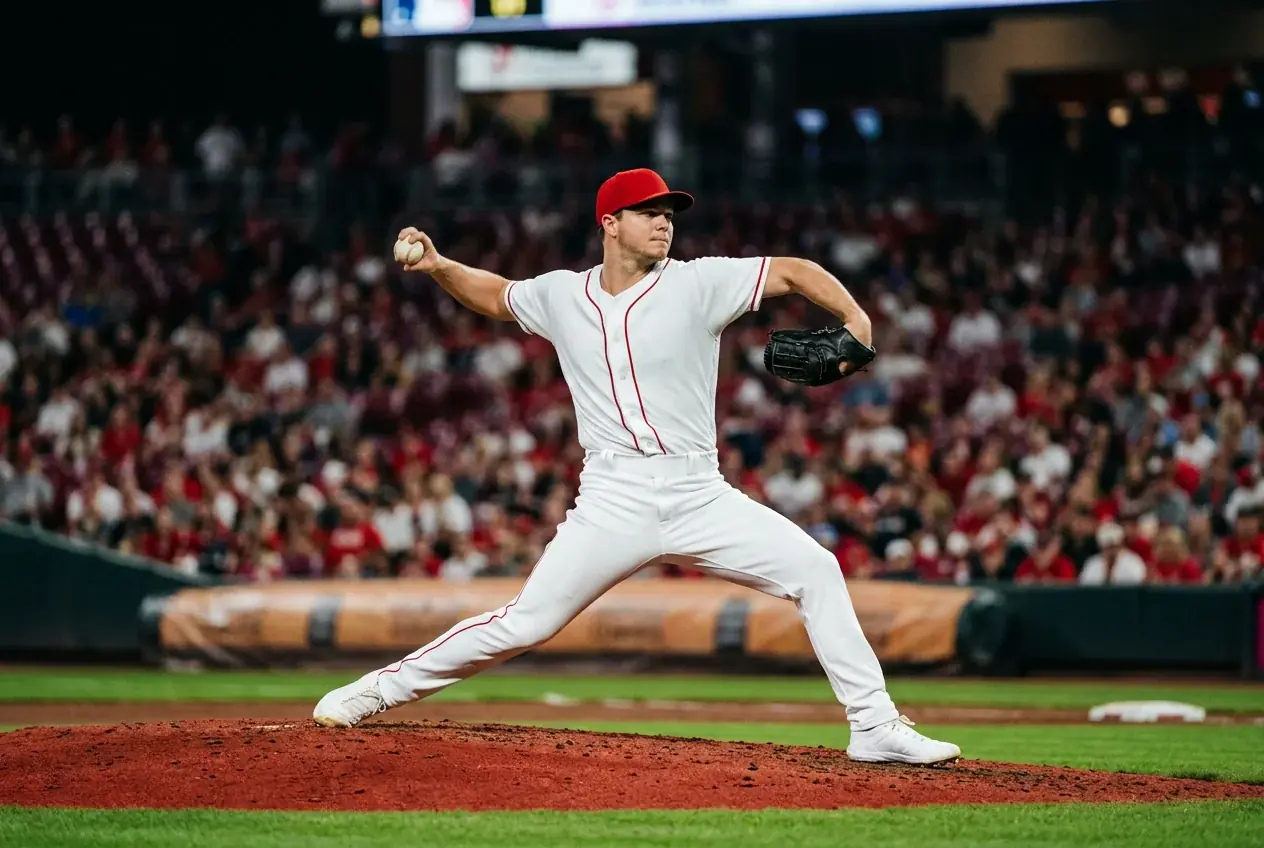
Pitcher props
Strikeouts (K), earned runs, hits allowed, walks issued, outs recorded, pitching total bases allowed
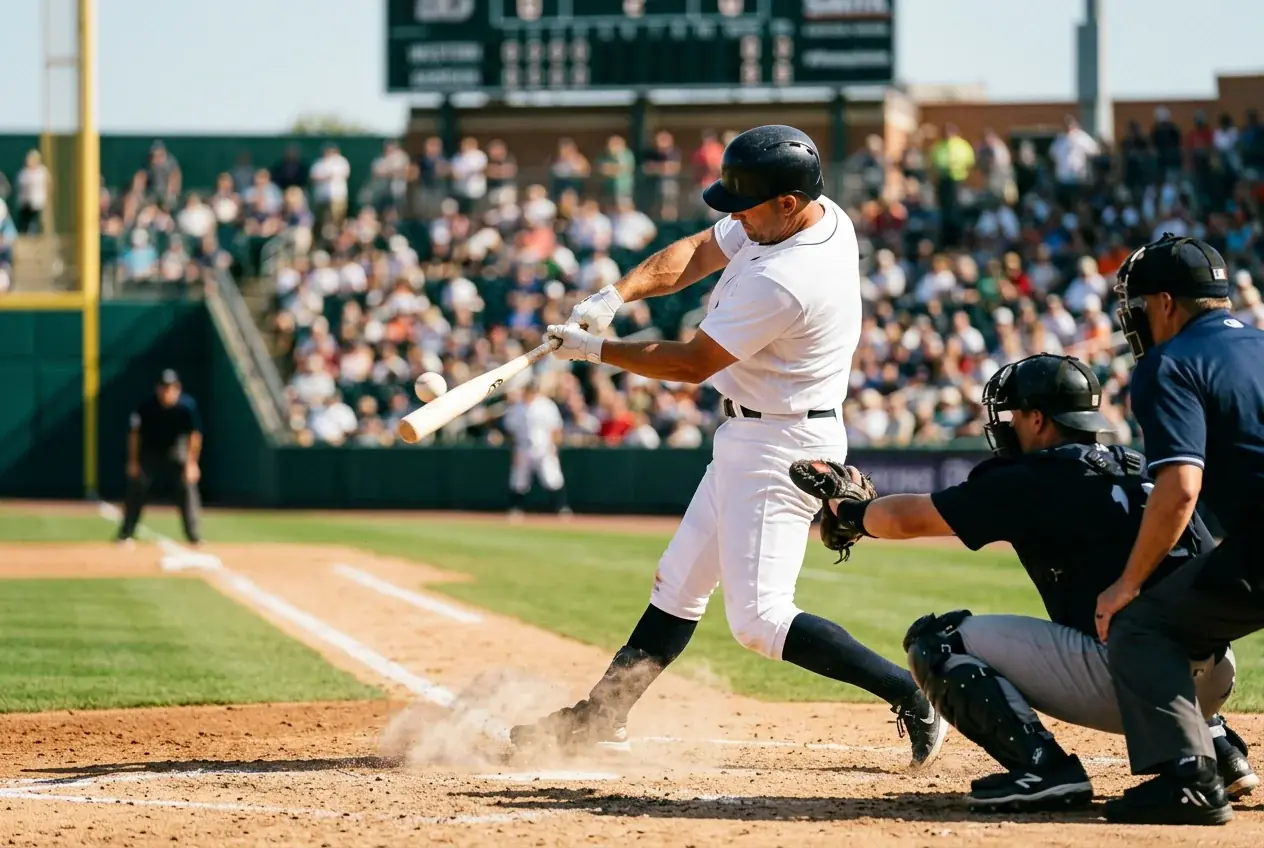
Batter props
Hits, home runs (anytime/first), total bases, runs scored, RBIs, stolen bases, walks drawn, H+R+RBI combo
Game-level props
NRFI/YRFI (no run / yes run first inning), first team to score, inning-specific totals
Strikeout props are the deepest, most data-rich market in baseball betting. Every pitch is tracked by Statcast, giving you whiff rates, chase rates, and zone percentages broken down by batter handedness. A pitcher’s strikeout ceiling depends on his stuff, the opposing lineup’s contact tendencies, and — something most bettors overlook — the home plate umpire’s strike zone. I cover the mechanics in detail in my strikeout props strategy guide, but the core principle is simple: the more a lineup swings and misses, the higher the K-total goes.
Home run props flip the lens to the batter. Exit velocity and barrel rate — the percentage of batted balls hit at optimal speed and launch angle — are the two metrics that predict home run output better than anything else. A batter barrelling the ball at 98+ mph with a launch angle between 25 and 30 degrees will find the seats regardless of which pitcher he faces. Ballpark dimensions add a second layer: a fly ball that dies on the warning track at Oracle Park clears the fence at Coors Field. The full framework is in my home run props breakdown.
Pitcher-side props
Data inputs: whiff rate, chase rate, pitch mix, opposing lineup K%, umpire zone, recent workload. Advantage: pitcher dominates the outcome. One player controls the variable. Lower variance than batter props over a season.
Batter-side props
Data inputs: exit velocity, barrel rate, contact rate, platoon splits, lineup position, park factor. Advantage: Statcast data is publicly available and granular. Higher single-game variance but strong predictive power in aggregate.
Total bases props reward consistency over power. A single is one total base, a double is two, a triple three, a homer four. Contact rate — the percentage of swings that make contact — predicts total bases output more reliably than batting average, because it captures the quality and frequency of contact without being skewed by defensive positioning. A hitter who makes hard contact regularly will accumulate total bases even on nights when the home run does not come.
H+R+RBI combo props bundle three statistics into a single line, typically set around 2.5 or 3.5 for everyday hitters. The appeal is that one big at-bat — a two-run homer, for instance — can cover hits (1), runs (1), and RBIs (2) in a single swing, pushing the combined total to four from a single event. The correlation between these three stats is what makes combos interesting: runs and RBIs are mechanically linked to hits and baserunners.
NRFI/YRFI (no run first inning / yes run first inning) strips the game down to a single half-inning from each side. You are betting on whether either team scores before the second inning begins. First-inning ERA, top-of-order aggression, and the starting pitcher’s first-inning pitch sequencing all feed into this market.
Stolen base props became a serious market after MLB’s 2023 rule changes enlarged the bases and restricted pickoff attempts, driving stolen base volume to levels not seen in decades. Sprint speed and catcher pop time are the opposing forces: a fast runner against a slow-release catcher is as close to a free edge as this sport offers.
The hierarchy of demand is clear. The markets with the most liquidity and the tightest lines are strikeouts, home runs, and total bases — in that order on most UK books. Combo props (H+R+RBI) and stolen bases sit a tier below, with thinner pricing and wider vig. Knowing which markets are deepest helps you focus your research where the edge is most exploitable.
How to Spot Value in MLB Prop Lines
Here is the uncomfortable truth most prop-picks sites will never tell you: only 3-5% of sports bettors are profitable over the long term. The other 95% are subsidising the industry. The difference between those groups is not luck, access to insider information, or a magic algorithm. It is a disciplined understanding of expected value — and the willingness to pass on a bet when the edge is not there.
Value exists when the probability you assign to an outcome is higher than the probability implied by the odds. That is the entire game. Everything else — the research, the models, the matchup analysis — is just a method for estimating that true probability more accurately than the sportsbook does.
Expected value calculation: strikeout over
Suppose a pitcher’s strikeout over 5.5 is priced at 1.87 in decimal odds.
Step 1: Convert odds to implied probability. 1 / 1.87 = 0.535, or 53.5%.
Step 2: Estimate true probability using data. After reviewing whiff rate, opposing lineup K%, umpire zone, and recent form, you estimate the true probability of 6+ strikeouts at 60%.
Step 3: Calculate EV. EV = (0.60 x 0.87) – (0.40 x 1.00) = 0.522 – 0.400 = +0.122. For every GBP 1 staked, you expect to earn GBP 0.12 profit over time.
Step 4: Confirm the edge is meaningful. An EV above +0.05 on a single prop is worth acting on. Below that, the variance may not justify the stake.
To break even at standard -110 odds (the American equivalent of roughly 1.91 decimal), a bettor needs a win rate of 52.38%. That sounds achievable until you realise it means winning more than half your bets against lines set by traders with access to the same data you have, plus proprietary models you do not. The margin for error is razor-thin, which is why the process matters more than any individual pick.
| Your estimated probability | Decimal odds offered | Implied probability | Edge | EV per GBP 1 |
|---|---|---|---|---|
| 55% | 1.87 | 53.5% | +1.5% | +GBP 0.03 |
| 60% | 1.87 | 53.5% | +6.5% | +GBP 0.12 |
| 50% | 1.87 | 53.5% | -3.5% | -GBP 0.07 |
The same odds can be a strong bet or a losing proposition depending on your probability estimate.
Three practical filters I apply before placing any MLB prop:

Filter one: sample size. I never build a case on fewer than 100 plate appearances or 50 innings pitched in the current season. Early-April lines are the loosest of the year precisely because the data is thin and sportsbooks are pricing off projections rather than performance. That creates opportunity, but only if you have done off-season homework and can lean on the previous season’s second-half splits.
Filter two: line movement direction. If a line opens at 5.5 strikeouts and moves to 6.5 by game time, the market has spoken — sharp money likely pushed it. I am not looking to chase a line that has already been corrected. I want the line before the market catches up to the data. That means placing props in the morning window, not thirty minutes before first pitch.
Filter three: is the edge structural or anecdotal? “He struck out ten last start” is anecdotal. “His whiff rate against right-handed batters ranks in the 95th percentile and tonight’s lineup is 70% right-handed” is structural. The first is noise. The second is signal. I have a deeper walkthrough of this process in my expected value strategy piece, but the principle belongs here because it governs every section that follows.
Ballpark Factors and Weather: The Hidden Variables
A fly ball off the bat at 102 mph and a 28-degree launch angle is a home run at Coors Field in Denver and a warning-track out at Oracle Park in San Francisco. Same swing, same contact quality, different result. If you are not adjusting for venue, you are pricing props with one eye closed.
Ballpark factor basics: A park factor index measures how much a venue inflates or suppresses a particular stat compared to the league average. A home run park factor of 1.20 means that park produces 20% more home runs than a neutral environment. Coors Field, Yankee Stadium, and Great American Ball Park consistently sit above 1.10 for home runs. Oracle Park, Tropicana Field, and Petco Park sit below 0.90. These are not small adjustments — they shift the true probability of a batter clearing a home run line by several percentage points.
The mistake most bettors make is treating park factors as a home run variable and nothing else. Ballpark dimensions affect total bases, hits, and even strikeout props indirectly. A pitcher-friendly park with deep fences tends to produce more fly-ball outs, which can push a pitcher’s strikeout prop down slightly because batters are putting balls in play rather than chasing pitches out of the zone. The interaction is subtle but measurable across a full season.
Coors Field in Denver sits at 1,580 metres above sea level. The thinner air reduces drag on the baseball, allowing fly balls to carry roughly 5-7% farther than at sea level. MLB even stores game balls in a humidor at Coors to counteract the effect — and the humidor has measurably reduced, but not eliminated, the park’s offensive inflation.
Weather layers on top of park factors in ways that matter for same-day props. Temperature is the biggest driver: warmer air is less dense, allowing the ball to travel farther. Research from multiple sabermetric sources consistently shows a measurable increase in fly-ball carry above roughly 24 degrees Celsius compared to sub-10-degree April nights. Wind direction matters at open-air parks — a 15 mph breeze blowing out to centre field at Wrigley can add 10-15 feet to a fly ball, while wind blowing in suppresses power. Humidity has a smaller but real effect, and altitude amplifies everything.

I check three things on game day before touching a batter prop: park factor for the relevant stat, temperature at first pitch, and wind speed plus direction relative to the outfield fence. If all three align — hitter-friendly park, warm evening, wind blowing out — the batter-side edge compounds. If they conflict, I am either passing or switching to a pitcher prop where the suppression factors work in my favour. The data sources for ballpark adjustments and weather impacts are free to access from the UK, and I walk through the specifics in my dedicated guides on ballpark factors and weather effects.
Same-Game Parlays: Opportunity, Maths and Risk
Same-game parlays are the sportsbook industry’s most profitable invention since the smartphone app. That sentence alone should tell you everything about whose side the maths is on — but it does not mean SGPs are worthless. It means you need to understand the mechanics before you touch them.
The hold-rate gap you need to know: Standard single bets carry a house edge of roughly 4.5%. Same-game parlays carry a hold rate of 20-35%. That is not a typo. The operator’s margin on a four-leg SGP can be seven times higher than on a straight bet. Every additional leg you add compounds the vig, and the sportsbook does not discount for correlation the way a mathematically fair market would.
An SGP combines multiple prop selections from the same game into a single wager. You might pair a pitcher’s strikeout over with a batter’s home run and a team total over, creating a three-leg parlay that pays at combined odds. The appeal is obvious: small stakes, large potential payouts. In New Jersey alone, parlays generate approximately 60% of online sports betting revenue for operators. Over 80% of FanDuel users placed at least one parlay bet in a single quarter, according to Flutter Entertainment’s earnings disclosures. The volume is staggering.
The reason SGPs print money for operators is that they do not price correlation accurately — or rather, they price it in their own favour. Two legs that are positively correlated (a team total over and a hitter’s total bases over, for instance, since a high-scoring game benefits batters) should, in a fair market, produce combined odds that reflect the overlap. Sportsbooks typically treat each leg as semi-independent, which inflates the combined vig.
How hold rate compounds across legs
Assume each individual leg carries a 5% vig (house edge).
One leg: effective house edge = 5%.
Two legs: 1 – (0.95 x 0.95) = 9.75% effective house edge.
Three legs: 1 – (0.95 x 0.95 x 0.95) = 14.26%.
Four legs: 1 – (0.95^4) = 18.55%.
Five legs: 1 – (0.95^5) = 22.62%.
Each added leg does not simply add 5% — it multiplies, because you need all legs to hit. By the time you reach five legs, nearly a quarter of your expected return has been consumed by the operator’s margin.
So when do SGPs make strategic sense? Only when you are combining legs with genuine positive correlation that the sportsbook is underpricing. A pitcher with a high strikeout rate facing a weak lineup correlates with a low team total for the batting side. A leadoff hitter with strong on-base numbers correlates positively with the team’s total runs. These are real structural links, and when the book does not fully adjust for them, the effective hold rate drops below the headline figure. I break this down with specific MLB examples in my same-game parlay strategy guide.
The trap — and I have fallen into it myself, early on — is building five or six-leg SGPs because the combined odds look thrilling. A +2500 payout feels like a lottery ticket, and that is precisely the psychology operators are exploiting. Karl Danzer at Sportradar noted that sport is now more personality-led, and that dynamic plays a significant role in how people bet. The emotional pull toward betting on a favourite player to do everything — hit a homer, score a run, drive in two, steal a base — is powerful. The maths behind that same bet is brutal. Discipline means limiting SGPs to two or three correlated legs, understanding the hold you are accepting, and never treating them as your primary wagering strategy.
The Integrity Question: Clase/Ortiz and What Changed
In November 2025, a federal indictment made public what the betting industry had quietly feared: player prop markets are uniquely vulnerable to manipulation by the very athletes they are built around. The case involved Cleveland Guardians closer Emmanuel Clase and an associate named Eddy Ortiz, and it reshaped the regulatory landscape for MLB props overnight.
What happened: According to federal prosecutors, the scheme exploited pitch-level micro-bets — wagers on the outcome of a single pitch. The conspirators allegedly placed hundreds of bets on specific pitch results, earning at least $450,000. Because a pitcher has near-total control over the type and location of a single pitch, the integrity exposure on these markets was far higher than on game-level or multi-at-bat props.
MLB Commissioner Rob Manfred responded decisively, stating that the industry worked with the league to address the risks posed by pitch-level markets, which he described as particularly vulnerable to integrity concerns. The result: a $200 cap on all pitch-level micro-bets and a ban on including them in parlays. Operators covering 98% of the US sports betting market adopted the restrictions.
Michal Lorenc, a professor of sports management at the University of Michigan, captured the underlying psychology: some athletes can justify that they are not throwing a game — they are only doing something small. That rationalisation is what makes individual-performance props structurally different from match-fixing. A pitcher who intentionally throws one ball instead of a strike has not affected the game outcome in any meaningful way, but he has determined the result of a single-pitch prop. The incentive to cheat scales inversely with the significance of the act, and that is a design flaw in the market itself.
For UK punters, the practical implications are straightforward. Pitch-level micro-bets, if available on your book, now carry strict stake limits. Standard player props — strikeouts, home runs, total bases, earned runs — remain unaffected and are far harder to manipulate because they aggregate across an entire game rather than isolating a single action. The Clase/Ortiz case did not discredit prop betting. It drew a bright line between markets where integrity can be monitored (multi-at-bat and game-level props) and markets where a single participant’s momentary decision can determine the outcome (pitch-level props). Stay on the right side of that line, and the integrity risk to your wagering is minimal.
Betting MLB Props from the UK: Sportsbooks, Odds Formats and Rules
I moved back to London after three years in New York, and the first thing I noticed about my UK betting accounts was how much thinner the MLB prop menus were. Markets that had thirty prop options per game on a US-facing operator might show eight or ten on a UK-licensed book. That gap has narrowed considerably over the past two seasons, but it still exists, and understanding it will save you frustration.
UK odds format: All UK-licensed sportsbooks default to decimal odds (e.g. 1.87) or fractional odds (e.g. 6/7). Decimal is simpler for prop analysis because the implied probability is just 1 divided by the decimal figure. If you see odds of 2.10, the implied probability is 1 / 2.10 = 47.6%. I recommend setting your accounts to decimal and keeping them there — it makes cross-book comparison instant.
Forty-seven percent of UK adults participate in some form of gambling, and 21% bet online, according to the Gambling Commission’s participation survey. But MLB is a minority sport in this market, which means prop liquidity is lower and lines can be slower to move compared to football or horse racing. That is not entirely a disadvantage. Slower line movement means pricing inefficiencies persist longer, giving you a wider window to exploit an edge before the market corrects.
The regulatory environment has tightened significantly. Since April 2025, a statutory gambling levy replaced the old voluntary model, with operators now paying a mandatory contribution to fund harm-reduction programmes. The Gambling Commission also introduced financial vulnerability checks: if your net spend exceeds GBP 150 within a 30-day period, your operator must assess whether you can afford your activity. This can result in account restrictions, deposit limits, or requests for proof of income. For a serious MLB prop bettor placing daily wagers across a 162-game season, that GBP 150 threshold arrives fast.
Do
- Set deposit limits proactively — it demonstrates self-regulation and may reduce the intensity of affordability checks
- Keep records of every bet, including stake, odds, and reasoning — this doubles as both analytical data and evidence of controlled betting if your account is flagged
- Use decimal odds consistently across all books for direct comparison
- Check prop availability before the MLB season begins — not every UK operator carries the same depth of markets
Do not
- Chase losses by increasing stakes after a bad run — this triggers affordability flags faster and destroys bankroll discipline simultaneously
- Assume US-focused prop analysis translates directly to UK books without checking whether the specific market is available
- Ignore withdrawal patterns — irregular, large withdrawals followed by immediate re-deposits can prompt operator scrutiny
- Overlook the time zone — most MLB games finish between 03:00 and 05:00 BST, so pre-match research and morning prop placement is the practical workflow
Remote gambling duty in the UK is set to increase from 21% to 40% for online casino products and from 15% to 25% for online sports betting by April 2027. That cost pressure on operators could eventually tighten prop margins, making line shopping across multiple books even more important than it already is. I maintain accounts with several UK-licensed operators specifically to capture the best available line on any given prop. The difference between 1.85 and 1.95 on the same market, compounded across hundreds of bets per season, is the difference between a profitable year and a losing one.
Bankroll Rules for Prop Bettors
The year I started tracking every bet in a spreadsheet was the year I stopped losing money. Not because my picks got better — my hit rate barely moved — but because I stopped staking emotionally. Bankroll management is the least glamorous topic in prop betting and the single most important one.
A bankroll is the total amount you have allocated specifically to betting, separate from living expenses, savings, and everything else. One unit is a fixed percentage of that bankroll — typically 1-2% for a disciplined bettor, never more than 3% on a single prop regardless of confidence level. If your bankroll is GBP 1,000, one unit is GBP 10-20. That feels small. It is supposed to. The 162-game MLB season produces hundreds of prop opportunities, and flat staking across high volume is what converts a small edge into actual profit.
Pre-bet checklist for every MLB prop
- Is my estimated probability at least 3 percentage points above the implied probability from the odds?
- Is my stake within 1-2% of my current bankroll (not my starting bankroll)?
- Have I checked the same prop on at least two other books for a better line?
- Is this bet based on structural data (rates, splits, park factors) rather than a single recent performance?
- Am I placing this bet because the edge is there, or because I want action on tonight’s game?
The last question on that checklist is the one that separates long-term winners from the rest. Wanting action is the most expensive emotion in gambling. A 162-game season offers so many opportunities that there is never a reason to force a bet on a night where the data does not support one. I routinely skip entire slates when the matchups do not produce a clear edge. Those blank nights do not feel productive, but they protect capital for the nights when the data lines up perfectly.
Flat staking at 1-2% per bet, recalculated weekly based on current bankroll, protects against drawdowns and ensures that no single loss — or even a ten-bet losing streak — threatens your season. A slim win-rate advantage compounding over hundreds of bets is what produces profit. A 70% hit rate produces nothing if your stakes are erratic and your bankroll is gone after a bad week in April.
If the Kelly criterion interests you — a mathematical formula for sizing bets proportional to your estimated edge — I explore it alongside flat staking in a dedicated comparison. For most punters starting out with MLB props, flat staking is the correct approach. Kelly requires accurate probability estimates, and overestimating your edge even slightly leads to catastrophic over-betting. Get the discipline right first. The optimisation comes later.
The MLB Prop Calendar: When Each Edge Peaks
MLB is the only major sport where the season is long enough to have its own climate. A prop bet in April is a fundamentally different animal from a prop bet in August, and treating them identically is one of the most common mistakes I see UK bettors make when they first approach baseball.
Late March – May
Cold bats, pitcher dominance. Strikeout props and NRFI are the strongest markets. Small sample sizes create loose lines.
June – August
Power surges as temperatures rise. Home run and total bases props peak in value. Pitcher fatigue begins affecting K-totals late in the period.
Trade deadline – September
Roster flux creates mispriced lines. Expanded rosters bring unfamiliar relievers. Fatigue compounds, and contenders rest starters late in blowouts.
The early season — late March through May — is where patience pays most. Sportsbooks are pricing off projection systems rather than current-year performance data, because hitters and pitchers have fewer than 100 plate appearances or 30 innings to draw from. If you have done off-season research and can lean on second-half splits from the previous year, you have an information advantage that the market has not yet priced in. Strikeout props are particularly exploitable early because pitchers are typically ahead of hitters in terms of readiness — arms build up through spring training while timing at the plate takes longer to sharpen.

Summer — June through August — is power season. MLB generates more than $12 billion in annual revenue across a season that peaks in attendance and television viewership during the warmest months. For prop purposes, what matters is the physics: warmer air is less dense, fly balls carry farther, and home run rates spike. This is when batter-side props — home runs, total bases, H+R+RBI combos — offer the richest menu. But be aware that pitcher workloads are accumulating. A starter who was electric in April with a fresh arm may see declining velocity and rising earned-run totals by late July.
The trade deadline in late July reshuffles rosters, and that creates a window of mispricing that lasts roughly two weeks. A hitter traded from a pitcher-friendly park to a hitter-friendly park may see his prop lines lag behind the venue change for several games. New bullpen acquisitions are unfamiliar to opposing lineups, temporarily boosting their strikeout props before hitters adjust. September brings expanded rosters, which means unfamiliar relievers facing major-league hitting for the first time — a recipe for volatile late-game props.
Understanding when each edge peaks is half the calendar; the other half is knowing which questions keep coming up season after season.
Common Questions About MLB Bet Props
What are MLB prop bets and how do they work?
MLB prop bets are wagers on individual player or game-specific outcomes that do not depend on the final match result. The most common form is an over/under on a player statistic — for example, whether a pitcher will record over or under 5.5 strikeouts. You select a side, place your stake, and the bet settles based on the actual statistical outcome of that player’s performance. Props can also be binary yes/no markets, such as whether a batter will hit a home run (anytime HR). The sportsbook sets the line based on projections, historical data, and matchup context, and the odds reflect the implied probability of each outcome.
What types of MLB player props can you bet on?
The main categories are pitcher props (strikeouts, earned runs, hits allowed, walks issued, outs recorded) and batter props (hits, home runs, total bases, runs scored, RBIs, stolen bases, walks drawn, and H+R+RBI combos). Game-level props include NRFI/YRFI (no run / yes run first inning), first team to score, and inning-specific totals. UK-licensed books typically carry a smaller selection than US operators, with strikeouts, home runs, total bases, and hits being the most consistently available markets.
How do you find value in MLB prop bets?
Value exists when your estimated probability of an outcome is higher than the implied probability reflected in the odds. To find it, you need to estimate the true probability using data — whiff rates, contact rates, park factors, platoon splits, and opposing lineup tendencies — then compare that estimate to the sportsbook’s implied probability. If your estimate exceeds the implied figure by at least three percentage points after accounting for the vig, you have a viable edge. Consistent value identification requires tracking your bets, reviewing your accuracy over hundreds of wagers, and refining your probability estimates over time.
What is a same-game parlay in MLB betting?
A same-game parlay (SGP) combines multiple prop or game selections from a single match into one bet. All legs must win for the parlay to pay out. The combined odds are higher than any individual leg, making payouts larger — but the hold rate (operator margin) on SGPs runs between 20% and 35%, compared to roughly 4.5% on single bets. SGPs are most effective when you combine legs with genuine positive correlation, such as a pitcher’s strikeout over with the opposing team’s total under, since both outcomes are supported by the same underlying event: the pitcher dominating.
Are MLB prop bets legal in the UK?
Yes. MLB prop bets are fully legal in the United Kingdom when placed through operators licensed by the Gambling Commission. UK-licensed sportsbooks are regulated under the Gambling Act 2005 and its subsequent amendments, including the 2025 statutory gambling levy and financial vulnerability check requirements. There are no sport-specific restrictions on MLB prop betting from a UK regulatory perspective. The key requirement is that you use a licensed operator — unlicensed offshore sites do not fall under Gambling Commission protection and offer no recourse if disputes arise.
What factors affect MLB pitcher strikeout props?
Five primary factors drive strikeout outcomes: the pitcher’s swinging-strike (whiff) rate, which measures how often batters swing and miss; the opposing lineup’s strikeout percentage, which captures how prone those hitters are to striking out; the home plate umpire’s strike zone size, which can add or subtract called strikes; the pitcher’s recent workload and velocity trends, which indicate arm freshness; and platoon matchups, since most pitchers generate higher strikeout rates against batters of the opposite hand. Secondary factors include the game’s run environment (pitchers pitch differently with large leads), catcher framing ability, and weather conditions that may affect pitch movement.
How do ballpark factors and weather impact MLB props?
Ballpark factors measure how much a specific venue inflates or suppresses particular statistics compared to the league average. A home run park factor of 1.15 means that venue produces 15% more home runs than neutral. Hitter-friendly parks boost home run, total bases, and hits props, while pitcher-friendly parks suppress them. Weather compounds these effects: higher temperatures increase fly-ball carry, wind blowing out to the outfield adds distance, and altitude (particularly at Coors Field) reduces air density. For UK bettors, checking park factor and game-time weather is a free, two-minute research step that adjusts your probability estimate before you even look at the pitcher-batter matchup.
Created by the ”mlb bet Props” editorial team.